NO2_TRO
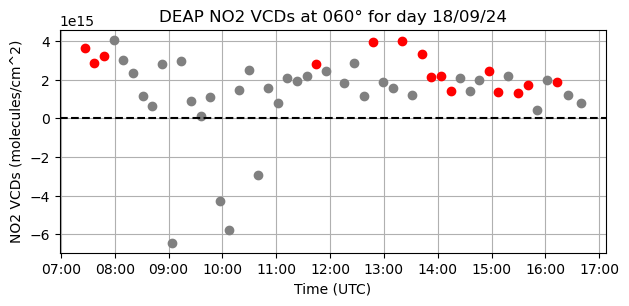
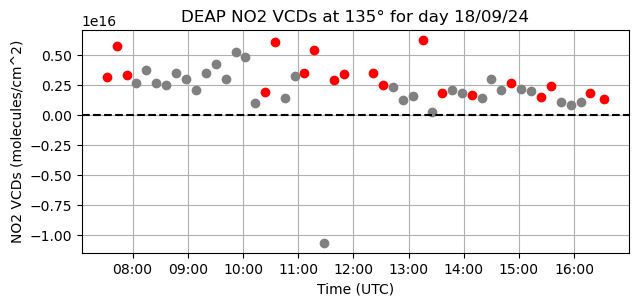
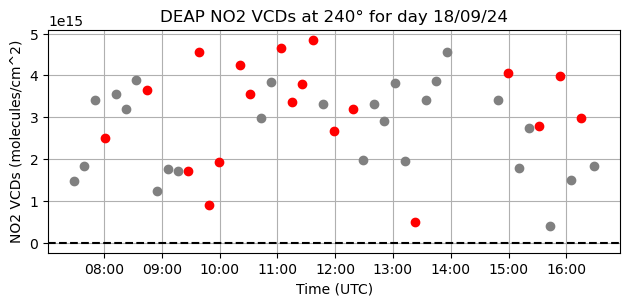
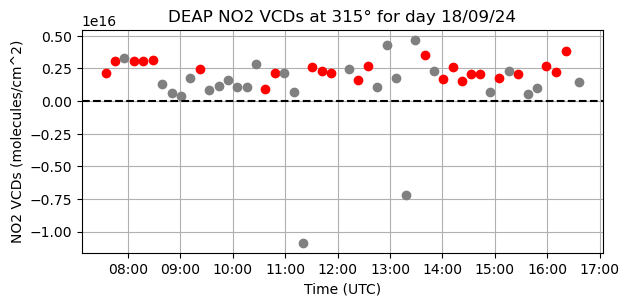
NO2 tropospheric VCDs for a whole day and for the azimuth (deg) angle reported in the title of the plot.
The tropospheric VCDs are reported in (molec/cm2) units versus the time of the day.
They are retrieved with the DEAP analysis software using the SkySpec-2D MAX-DOAS measurements of the elevation scans.
The plots are uploaded (if available) on a daily basis.
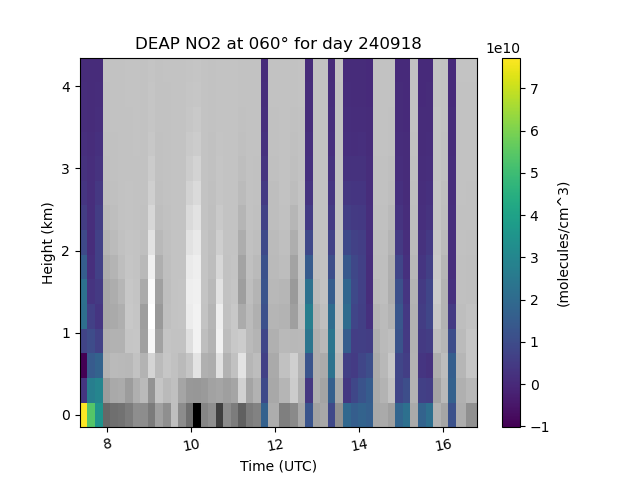
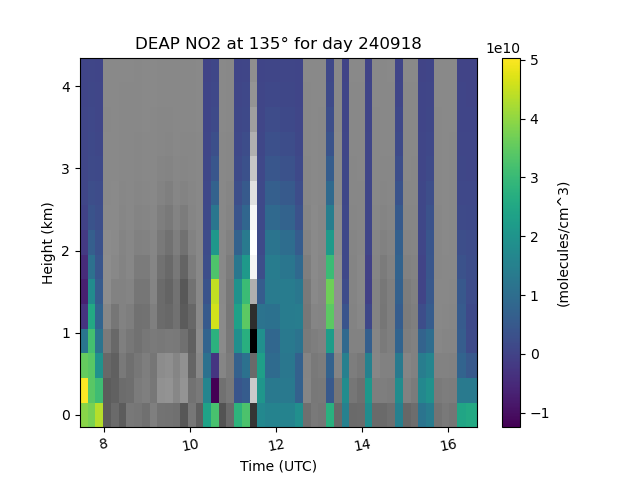
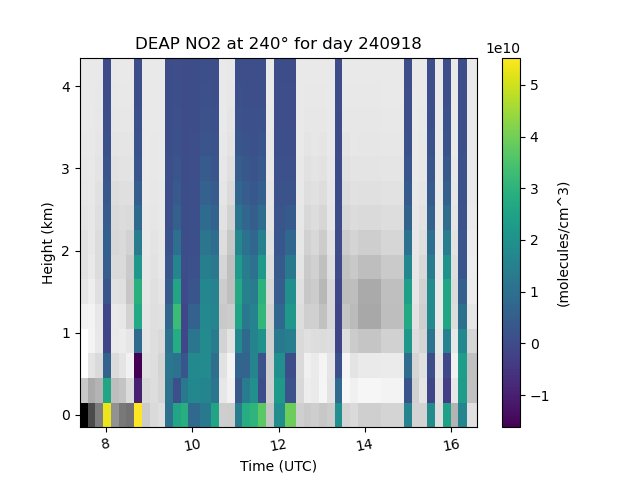
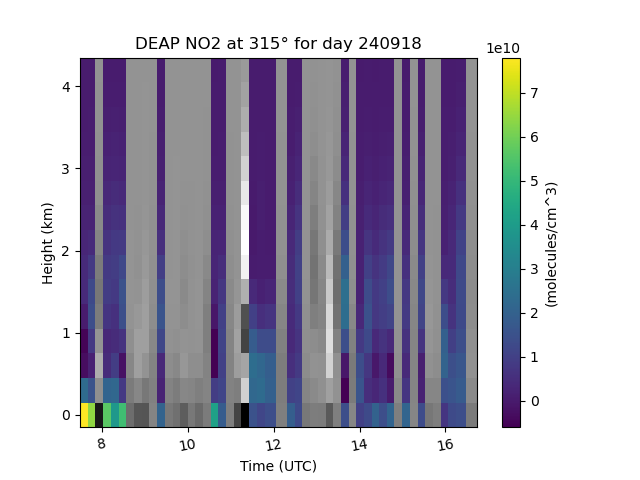
NO2
NO2 vertical distributions for a whole day and for the azimuth (deg) angle reported in the title of the plot.
The tropospheric vertical profiles are reported in (molec/cm3) units versus the time of the day.
They are retrieved with the DEAP analysis software using the SkySpec-2D MAX-DOAS measurements of the elevation scans.
The plots are uploaded (if available) on a daily basis.
NO2 VCDs
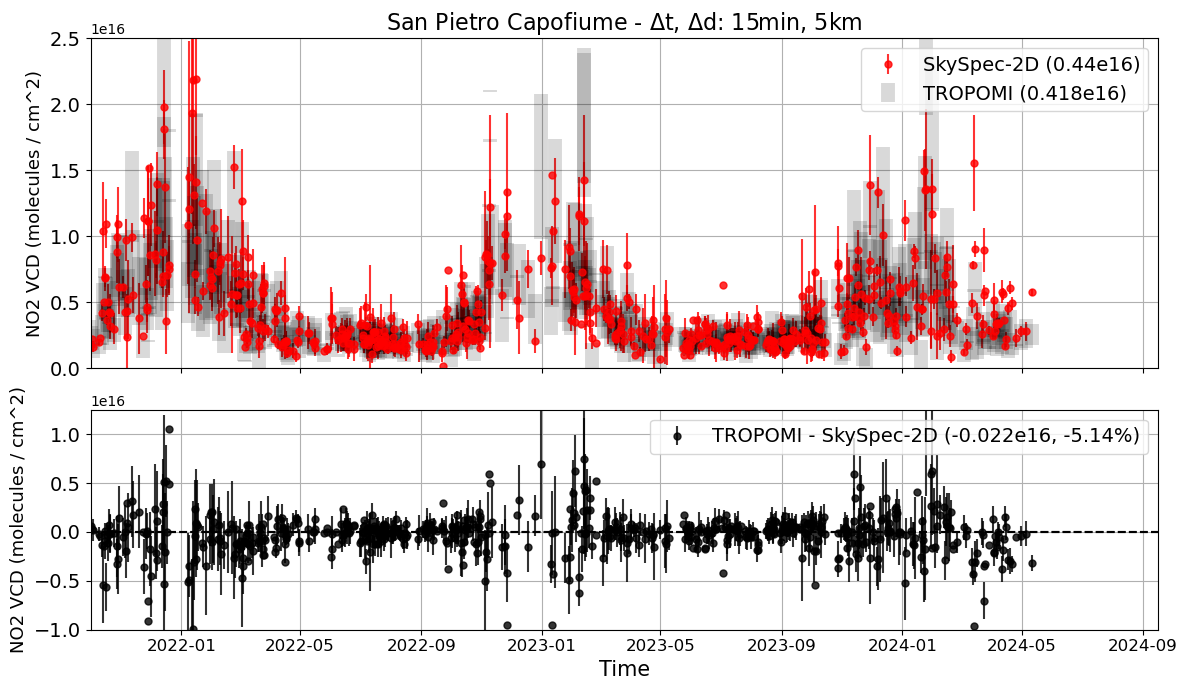
NO2 VCDs retrieved from zenith-sky VIS spectra acquired by SkySpec-2D (red dots).
They are NO2 VCDs averaged in a 15 minutes time range around the TROPOMI overpass.
TROPOMI data (grey shadows) represent the NO2 VCDs averaged within a 5 km radius around the SkySpec-2D position.
The plot is not uploaded regularly, as includes an external dependence on TROPOMI overpasses data which need to be downloaded and extracted before being analysed.


